RF Testing · Technical Guide
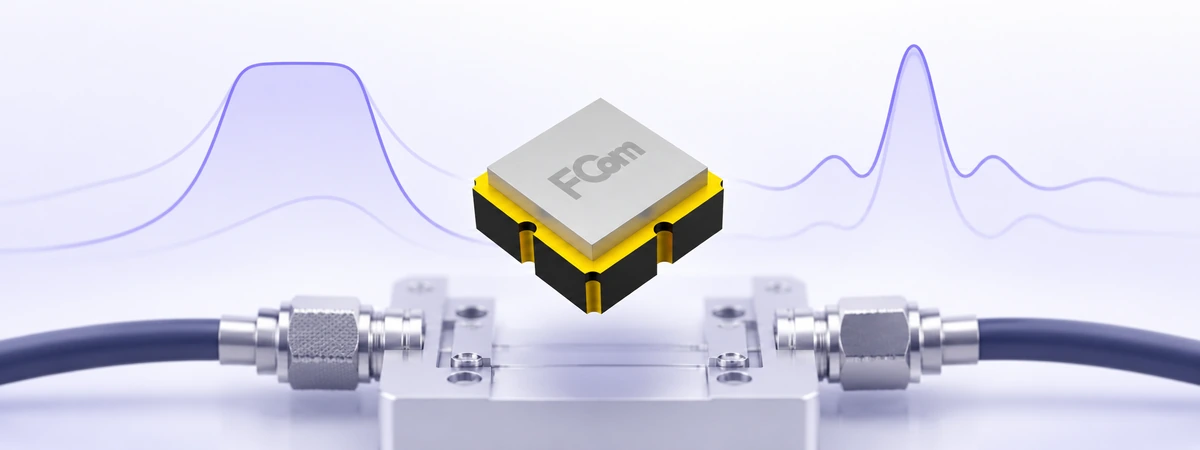
A useful SAW filter measurement must distinguish the filter’s response from the effects of cables, fixtures and matching networks. A vector network analyzer (VNA) provides transmission and reflection data, including phase, so engineers can evaluate loss, bandwidth, matching and group delay under defined conditions.
FCom Fuji Crystal · Technical Guide
1. Define the device and test conditions
Start with the exact part number and datasheet revision. Record the passband, stopband ranges, port impedances, pin assignment, matching circuit, test temperature and permitted input power. This guide’s basic connection assumes a single-ended two-port filter; balanced devices require an appropriate balanced measurement arrangement.
Connect VNA port 1 to the filter input and port 2 to its output through the specified fixture. Do not assume every SAW filter is directly matched to 50 Ω. A specification may apply to the filter together with particular matching components; removing them changes the network being measured. [1]
Use a small-signal source level within the device’s rating. Set a sweep covering the required bands and enough frequency points to resolve narrow features. Record actual test conditions rather than relying on an instrument preset.
2. Calibrate and account for the fixture
Perform a full two-port calibration using suitable standards and a method compatible with the connection geometry, such as SOLT or TRL. Full vector correction addresses reflection and transmission errors more completely than a simple through normalization. [2]
A calibration at the coaxial cable ends leaves the board launches and fixture inside the measured network. To report the filter alone, calibrate at its terminals where practical, or remove a characterized fixture mathematically through de-embedding. If matching components belong to the specified application circuit, clearly state whether they remain included. [1]
Check a suitable verification standard after calibration. Keep cables stable and connectors repeatable. Recheck after changing adapters, moving the setup significantly or changing temperature. Calibration reduces systematic errors; it does not remove random noise or guarantee that later drift is negligible. [2]
3. Read the S-parameters correctly
For a two-port network, S₂₁ describes forward transmission, S₁₂ reverse transmission, S₁₁ input reflection and S₂₂ output reflection. Each is complex, containing magnitude and phase. [3]
| Quantity | Expression | Interpretation |
|---|---|---|
| Transmission | S₂₁(dB) = 20 log₁₀|S₂₁| | A passive filter normally shows negative values. |
| Insertion loss | IL = −20 log₁₀|S₂₁| | Report as positive loss in dB. |
| Input return loss | RL = −20 log₁₀|S₁₁| | A larger positive value indicates less reflection. |
| Output return loss | RL = −20 log₁₀|S₂₂| | Evaluate over the specified band. |
For example, S₂₁ = −2.4 dB corresponds to 2.4 dB insertion loss under these conditions. S₁₁ = −15 dB corresponds to 15 dB return loss. With different or complex source/load impedances, evaluate the specified terminated network instead of applying a 50 Ω result directly.
4. Measure bandwidth and passband ripple
Use the datasheet’s bandwidth reference. For a peak-relative x dB bandwidth, find the lower and upper frequencies where transmission is x dB below its passband maximum. An absolute insertion-loss limit is a different threshold. [4]
BWx dB = fH − fL
Edge-midpoint frequency = (fH + fL) / 2
The edge midpoint and peak-transmission frequency need not be identical. Report the definition used.
Illustrative example: If peak S₂₁ is −2 dB, the peak-relative 3 dB threshold is −5 dB, while the 1 dB threshold is −3 dB. If the 3 dB crossings occur at 99 MHz and 101 MHz, the 3 dB bandwidth is 2 MHz and its midpoint is 100 MHz. These numbers are examples, not FCom specifications.
Measure passband ripple as the maximum minus minimum transmission level, in dB, across the stated passband. Do not substitute the entire 3 dB bandwidth for the ripple band unless the specification defines it that way. [4]
5. Measure group delay
Select the S₂₁ group-delay trace. Group delay is derived from the slope of transmission phase:
τg = −(1 / 2π) × dφ / df
With phase φ in radians and frequency f in Hz, τg is in seconds. For phase in degrees, use −(1 / 360) × dφ / df.
The VNA estimates this slope over a frequency interval called the aperture. A smaller aperture resolves more detail but is more sensitive to noise; a wider aperture smooths local variation. Record it whenever comparing delay results. Use sufficiently close frequency points to avoid ambiguous phase changes between samples. [5]
State the passband used for evaluation and report delay ripple as maximum minus minimum delay over that band. Evaluate delay where transmission has adequate signal-to-noise ratio; deep-stopband phase data may be unreliable.
6. Verify stopband attenuation
Measure every specified rejection interval. For a minimum attenuation requirement across a band, check its weakest attenuation point rather than selecting the deepest notch. Confirm whether rejection is referenced to the input level or to a passband reference.
For example, a −50 dB stopband transmission level is 50 dB attenuation relative to the matched through reference. If passband transmission is −2 dB, suppression relative to that passband level is 48 dB.
Narrower IF bandwidth and sweep averaging can improve noise-limited measurements. Check receiver noise and leakage before accepting deep rejection values. Increasing source power may improve signal level, but must remain within the filter’s linear operating region and instrument limits. [6]
If the trace reaches the verified setup limit, report that limitation rather than an exact filter attenuation. Use separate passband and stopband sweeps when different resolution or dynamic-range settings are needed.
7. Record a repeatable result
Save the complex S-parameter data as a Touchstone file, together with readable plots and a settings record:
- Part number, sample identity, datasheet revision and temperature.
- Port mapping, reference impedance, fixture and matching components.
- Calibration method, reference plane and de-embedding status.
- Sweep ranges, point count, source power, IF bandwidth and averaging.
- Bandwidth threshold, ripple band, delay aperture and stopband references.
- Applicable limits, measured results and relevant uncertainty.
Frequently asked questions
Why does my result differ from the datasheet?
First compare matching, port impedance, reference plane, power and temperature. Then check bandwidth and ripple definitions.
Is through normalization enough?
It can support a basic transmission check, but does not replace full two-port vector correction when mismatch errors matter.
Can 3 dB bandwidth demonstrate a 1 dB requirement?
No. Measure at the specified threshold and reference level.
Why does changing the delay aperture change the trace?
It changes the frequency interval used to estimate phase slope, trading local detail against noise sensitivity.
Review your SAW filter measurement with FCom
Send the part number, test schematic, calibration details, VNA settings and S-parameter file to FCom@fujicrystal.com. Include the datasheet limit being evaluated so we can compare the measurement conditions with the specified test circuit.
Technical references
- Rohde & Schwarz. Virtual Embedding Networks for Vector Network Analyzer ZVR, 1EZ45 (PDF). Includes a SAW filter fixture example.
- Keysight. Applying Error Correction to Vector Network Analyzer Measurements.
- Rohde & Schwarz. Understanding S-parameters.
- Keysight. Filter Measurements. Bandwidth, center frequency and ripple.
- Keysight. Group Delay Format. Phase slope, aperture and sampling considerations.
- Keysight. Dynamic Range. Noise-floor limits and filter rejection measurements.